The laboratory impinging jet
Large-scale laboratory experiments of scour hole development in broken-up rock, generated by rectangular-shaped oblique jets impinging in a plunge pool, have been performed in the hydraulics laboratory of the Civil Engineering Department at Stellenbosch University, South Africa (Bosman & Basson (2020), Bosman (2021)).
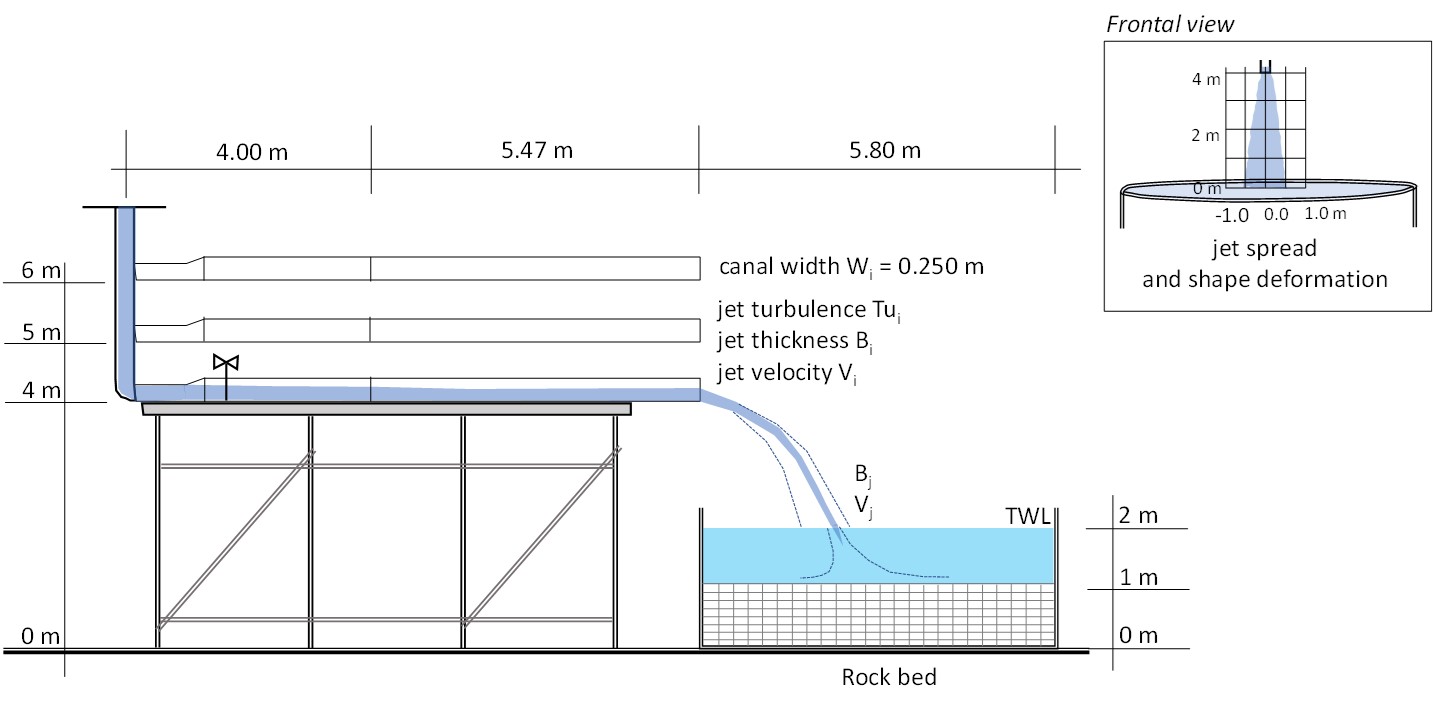
The physical model is illustrated on the left and consists of a zero-sloped 0.25 m wide rectangular canal at issuance, replicating an uncontrolled dam spillway. The canal could be adjusted to three different fixed heights above the movable rock bed: 3 m, 4 m and 5 m (prototype heights for 1:20 model scale: 60 m, 80 m and 100 m respectively). The tailwater depth at the plunge pool was adjustable between 0.5 m and 1 m (prototype: 10 m and 20 m respectively). The plunging jets generated unit discharges between 0.100 and 0.224 m3/s/m (prototype: 35 to 80 m3/s/m).
The laboratory rock mass
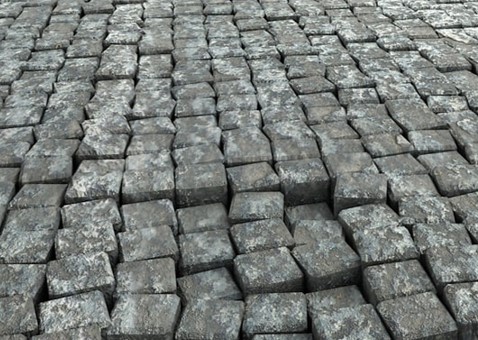
The broken-up rock bed was modelled by using tightly hand-packed concrete paver blocks (cobblestones), generating a uniform three-dimensional open-ended horizontal and vertical rock joint network. The two rock sizes tested were rectangular concrete pavers with x, y, z dimensions of 0.1 m × 0.1 m × 0.05 m and 0.1 m × 0.1 m × 0.075 m (prototype: 2 m × 2 m × 1 m and 2 m × 2m × 1.5 m respectively). The paver block densities used were 2’355.4 kg/m3 (for 1m high blocks) and 2’388.1 kg/m3 (for 1.5 m high blocks) respectively.
During each of the experimental tests, the scour of the rock bed by the free-falling rectangular jet was monitored by Bosman and Basson (2020) until scour in the plunge pool stopped and equilibrium conditions were reached, corresponding to test conditions with downstream mounding of blocks. The bed profile of the equilibrium scour hole was then surveyed.
The same test was then repeated, but instead of leaving the scoured blocks in the pool, the blocks deposited downstream were continuously removed until equilibrium conditions were reached, corresponding to test conditions without downstream mounding. The bed profile of the so-formed equilibrium bed profile was surveyed again.
The topography of the bed profiles was surveyed using a 3D laser scanner at a high resolution of 10’000 pixels/360°.
Case 1: without mounding and 1 m high blocks(1)
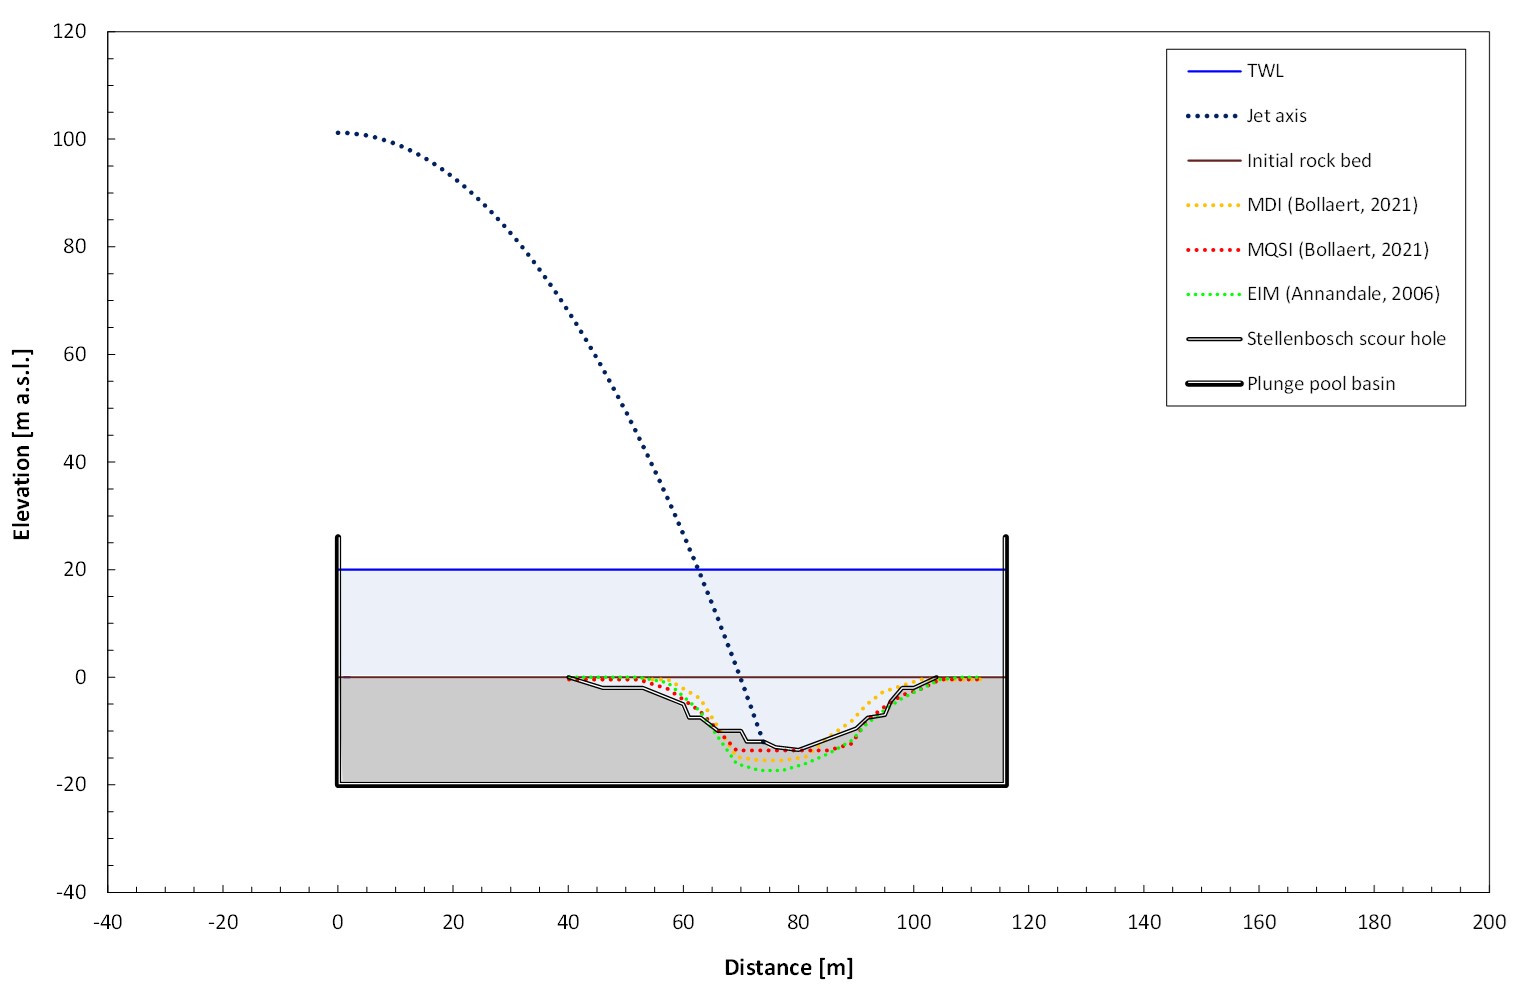
The first case concerns an experiment without downstream mounding during scour formation, and for q = 80 m2/s, a head of 100 m and a tailwater level of 20 m. The rock blocks have a height of 1 m. This case has been used as case study for the following rocsc@r® computational models that apply to fully broken-up rock :
- MDI (2021) model based on C’p values (Federspiel, 2010 and Bollaert, 2021)
- MQSI (2021) model based on quasi-steady and pulsating forces (Bollaert, 2021)
- EIM (2006) model based on Kirsten erodibility index (Annandale, 2006)
The figure on the left illustrates the results of the scour computations performed by applying the MDI, MQSI and EIM methods. Basic parameters of the MDI and MQSI methods have been calibrated to fit the laboratory observed scour results without mounding.
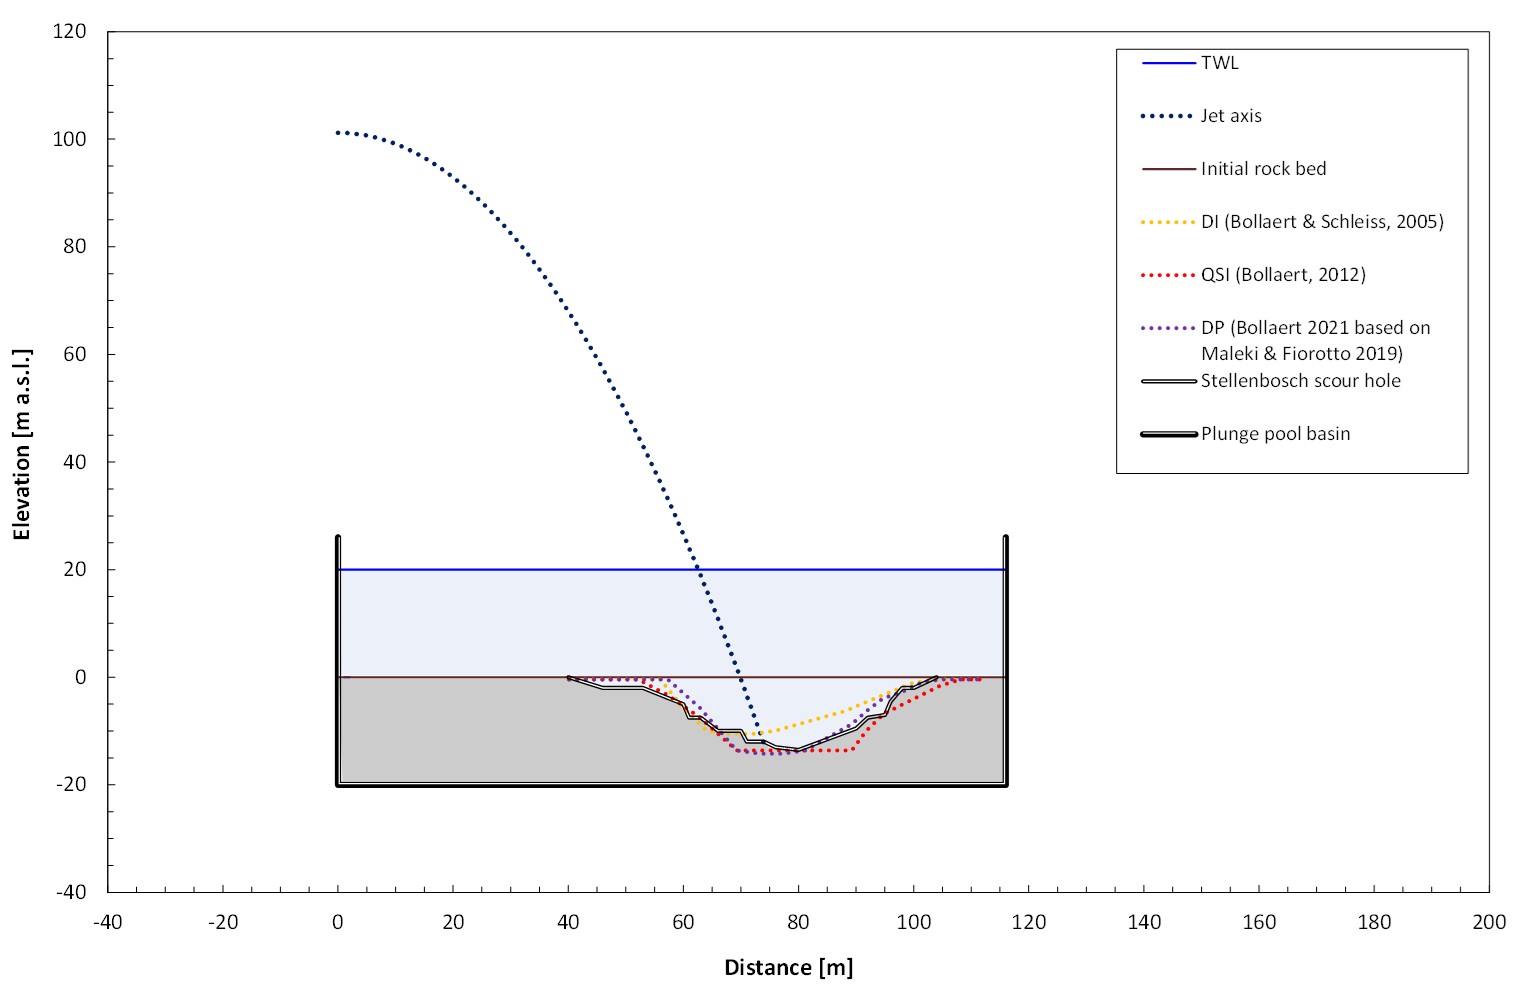
Case 1: without mounding and 1 m high blocks(2)
This first experiment without mounding has furthermore been used also as case study for the following rocsc@r® computational methods that apply to fully broken-up rock :
- DI (2002) model based on CI values (Bollaert & Schleiss, 2005)
- DP (2019) model based on W values (Bollaert 2021, based on Maleki & Fiorotto, 2019)
- QSI (2012) model based on quasi-steady forces (Bollaert, 2012)
The figure on the left illustrates the results of the scour computations with the DI, QSI and DP methods, for the same test without downstream mounding and for q = 80 m2/s, a head of 100 m and a tailwater level of 20 m.
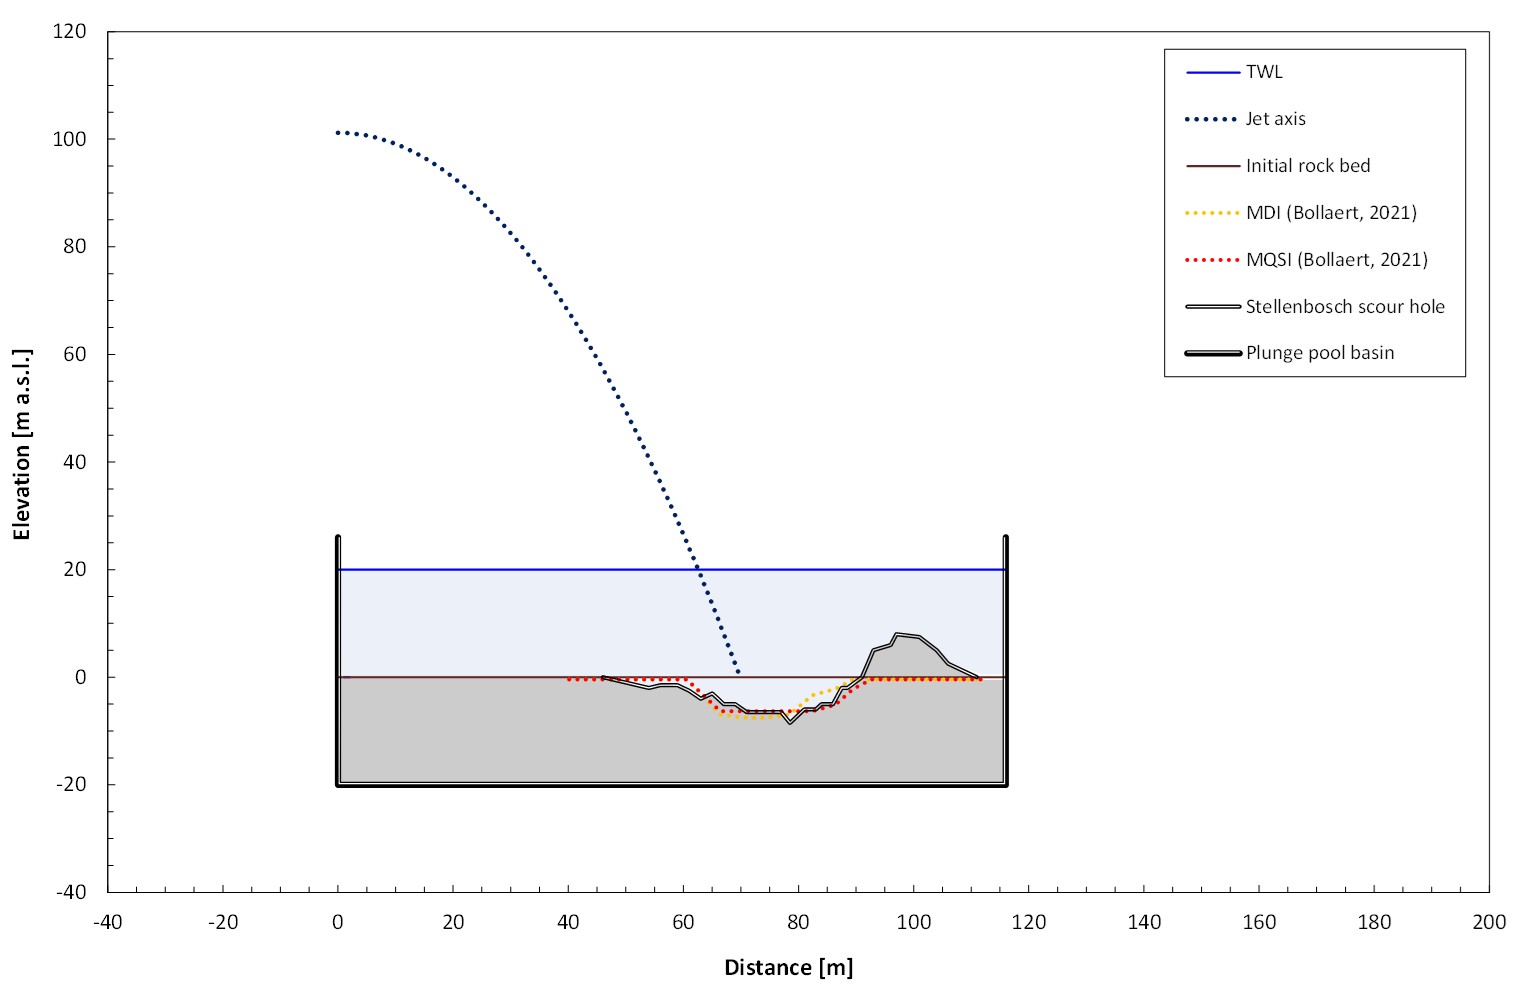
Case 2: with mounding and 1 m high blocks
The second case concerns the same experiment but with downstream mounding during scour formation (for q = 80 m2/s, a head of 100 m and a tailwater level of 20 m). The rock blocks have a height of 1 m. The following rocsc@r® computational methods are visualized on the left-hand side :
- MDI (2021) model based on C’p values (Bollaert, 2021)
- MQSI (2021) model based on quasi-steady and pulsating forces (Bollaert, 2021)
The figure on the left illustrates the results of the scour computations with the MDI and MQSI methods. Basic parameters of the MDI and MQSI methods have been calibrated to fit the laboratory observed scour results with mounding.
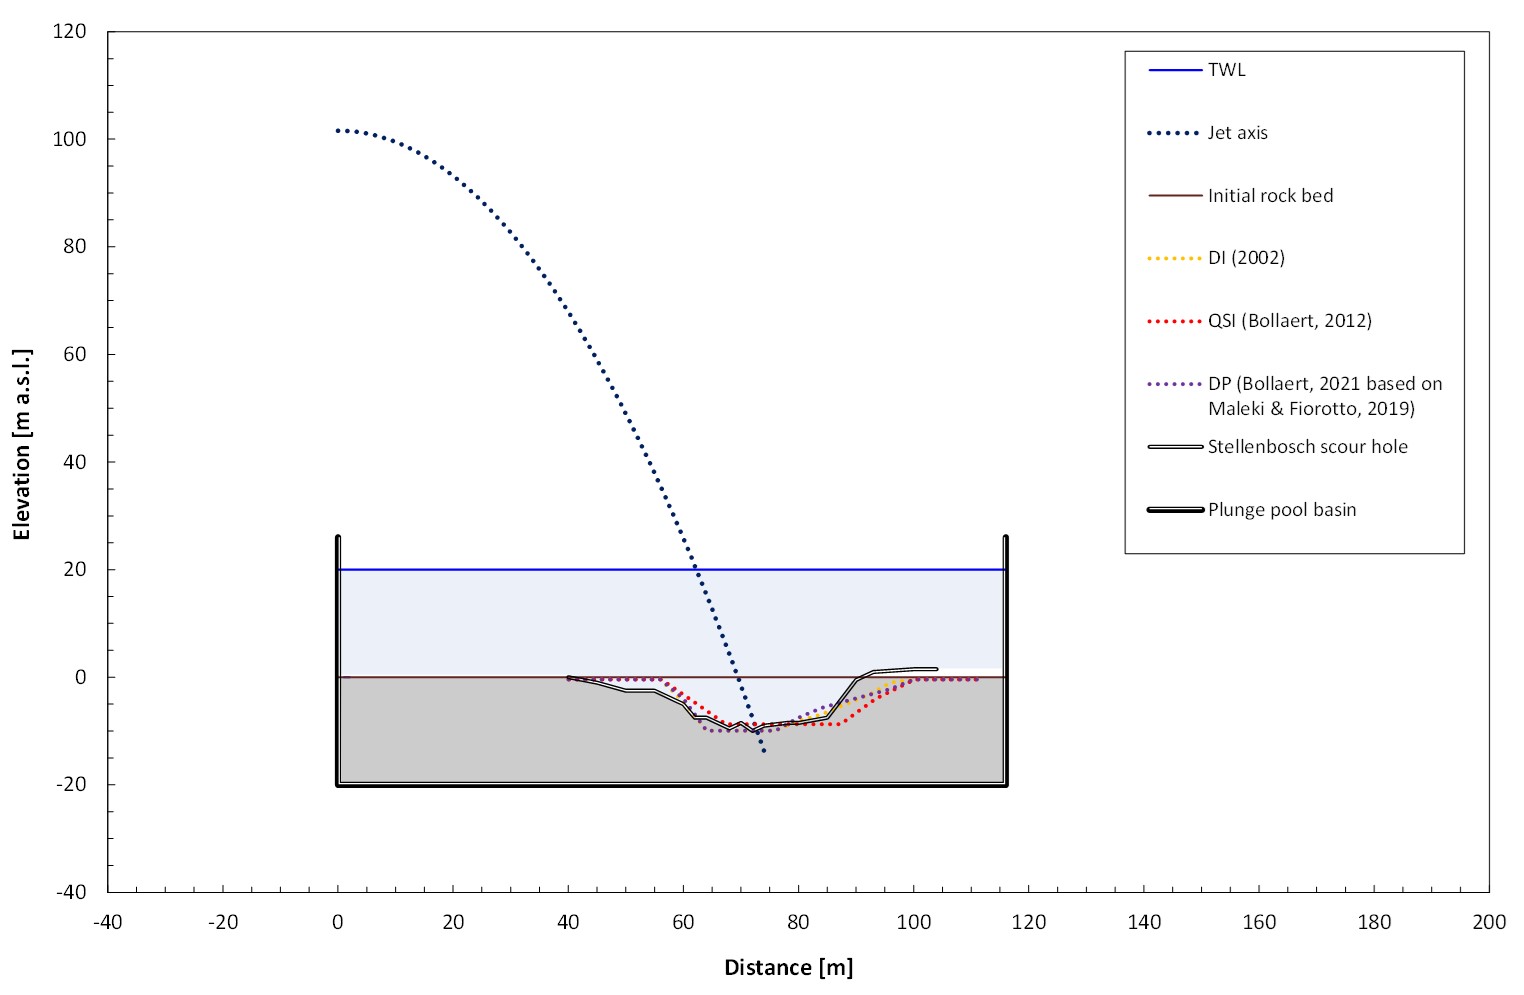
Case 3: without mounding and 1.5 m high blocks
The third case concerns the same experiment as the first one, i.e. without downstream mounding during scour formation (for q = 80 m2/s, a head of 100 m and a tailwater level of 20 m). Neverhteless, the rock blocks now have a height of 1.5 m instead of 1 m. The following rocsc@r® computational methods are visualized on the left-hand side :
- MDI (2021) model based on C’p values (Bollaert, 2021)
- MQSI (2021) model based on quasi-steady and pulsating forces (Bollaert, 2021)
The figure on the left illustrates the results of the scour computations with the MDI and MQSI methods. The parameters used by the different visualized methods were the same than the ones used to fit the test case with a 1 m block height.
