The dam and the unlined plunge pool
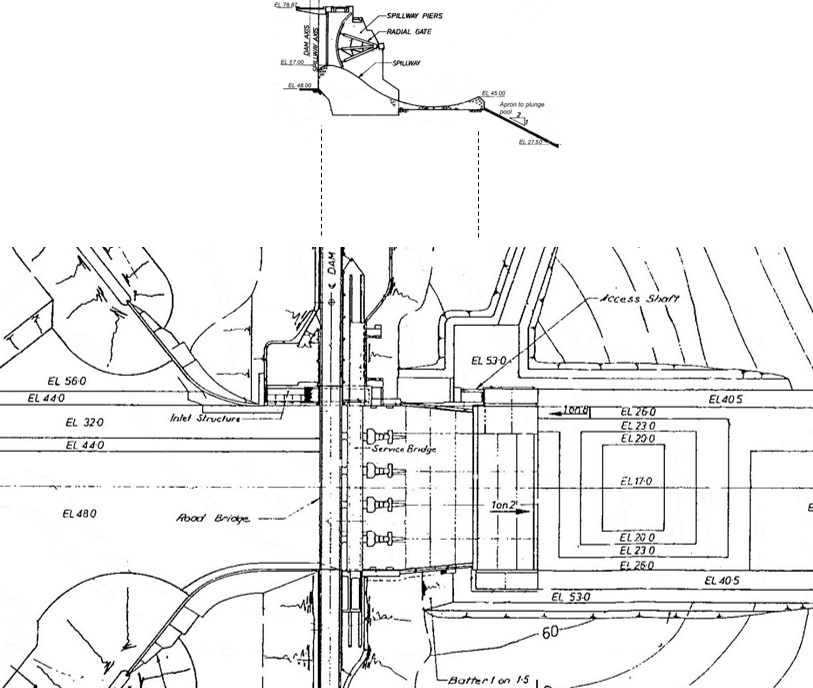
Wivenhoe Dam was constructed in the early 1980s, on the Brisbane River, Australia. The earth-fill dam incorporates a gated ski-jump spillway on the left abutment, which discharges into a pre-excavated unlined plunge pool and outlet channel. The spillway has five radial gates each 12 m wide and 16 m high. The figure onthe left-hand side shows the profile of the spillway and concrete apron below the bucket (source: Lesleighter et al., 2013).
The spillway and the plunge pool were studied in a physical model during the design phase, and this led to the selection of the plunge pool geometry. On the basis of the model studies, using a mobile material, but recognizing the expected ability of the sandstone to resist scour, the plunge pool geometry was defined as shown. The pre-excavated plunge pool comprised benches stepping down in increments generally of 3 m, to the lowest invert level of EL 17.0 m Australian Height Datum (AHD).
The geology of the plunge pool and outlet channel, comprising massive sandstone with reasonably widely-spaced horizontal joints, provided appealing conditions for the construction of the pre-excavated pool with economy of sizing not available from weaker and more heterogeneous geology.
The 2011 flood event
Major floods occurred at the site in January 2011, with post-analysis of the inflows indicating that the flood was less frequent than the 1 in 2000 year Annual Exceedance Probability (AEP). Large discharge releases were required over some days during a period when concurrent discharges were experienced in tributary creeks downstream. While the spillway had discharged on a number of occasions previously, the January discharges were prolonged and at larger magnitudes, leading to dramatic erosion of rock from the plunge pool.
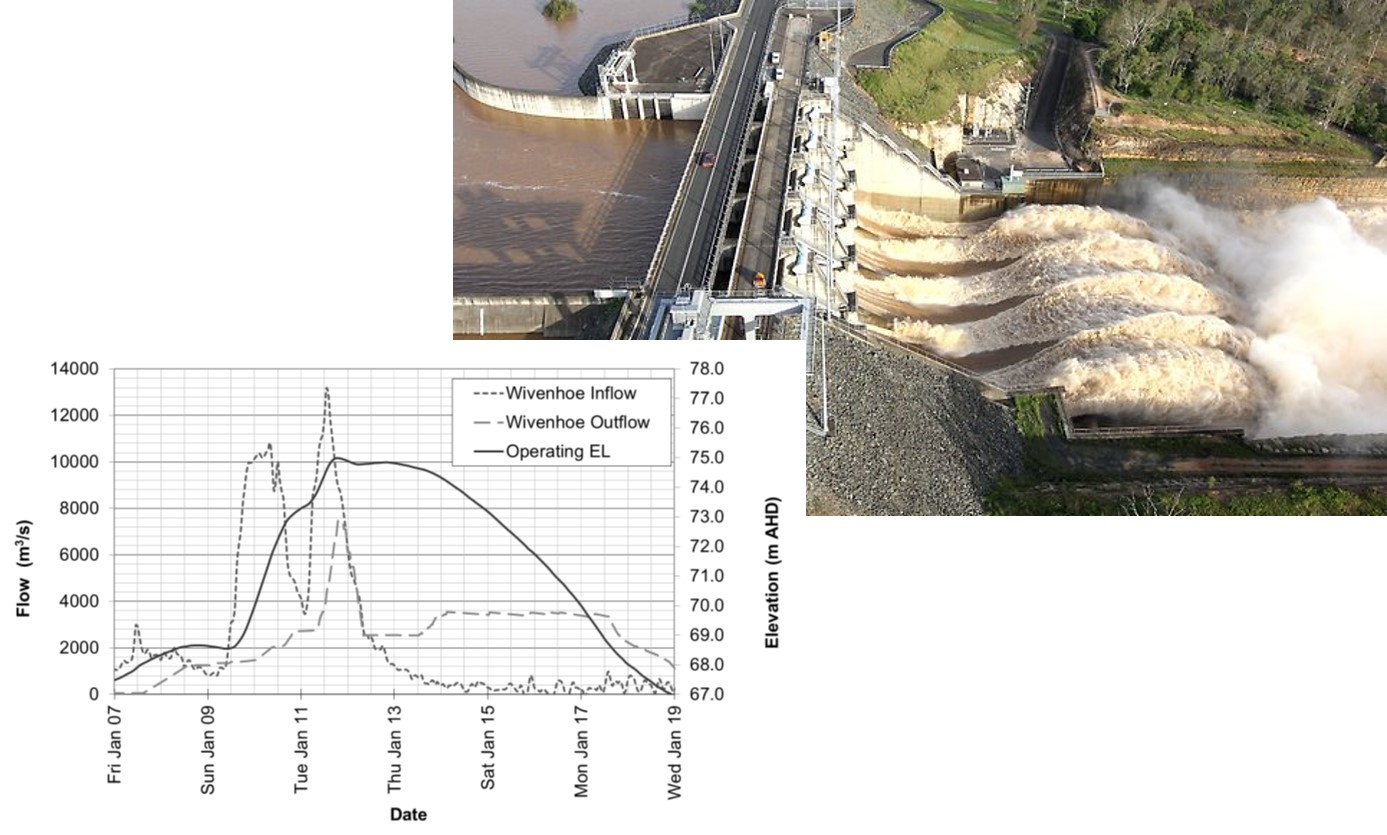
The discharge from Wivenhoe spillway during the floods peaked at 7,500 m3/s (i.e. q ~ 110 m3/s/m), which was 50% more than the design flood for the plunge pool. In the days following the peak discharge, releases in the order of 3,500 m3/s prevailed for a period of four days. The figure on the right hand-side shows an aerial view of the spillway during the flood, as well as the inflow-outflow hydrographs during this time (source: Lesleighter et al., 2013).


The observed scour formation
Due to the high discharges occurring in tributaries downstream of the dam, the tailwater remained elevated for a number of days, and it was only when the tailwater subsided four days after passing the peak discharge that the top of an enormous rock mound that had developed in the spillway channel was revealed. The pile of rocks was approximately 11 m high, and nearly the full width of the channel, as seen in the figure on the left-hand side. Boulders of up to 15m x 10m x 3m, weighing over 1,000 t were observed in the pile of eroded rocks in the spillway channel, as seen in Figure 4. The boulders appeared to have separated on the near-horizontal bedding planes. The scoured material had block heights between 1 and 3 m, for block side-lengths from 4 to 12 m. The ratio of block height to side-length is thus 1 to 4.
Bathymetric surveys of the plunge pool were undertaken in 2000 following the 1999 flood, and also in January 2011 after the flood, allowing for assessment of the progression of scour over time. It can be seen that the majority of scour which occurred during the January 2011 flood, as indicated in the longitudinal section, removed material from the downstream extent of the plunge pool to extend its length by more than 40 m and its base down to 2 m below design (source: Lesleighter et al., 2013).
The photographs illustrate the extent of the rock mound in the tailwater channel following the flooding. Many of the monoliths in these pictures indicate bedding-plane spacings in the range of 1 m to 3 m.
The rocsc@r™ scour reproduction (DI, QSI, MDI, MQSI)
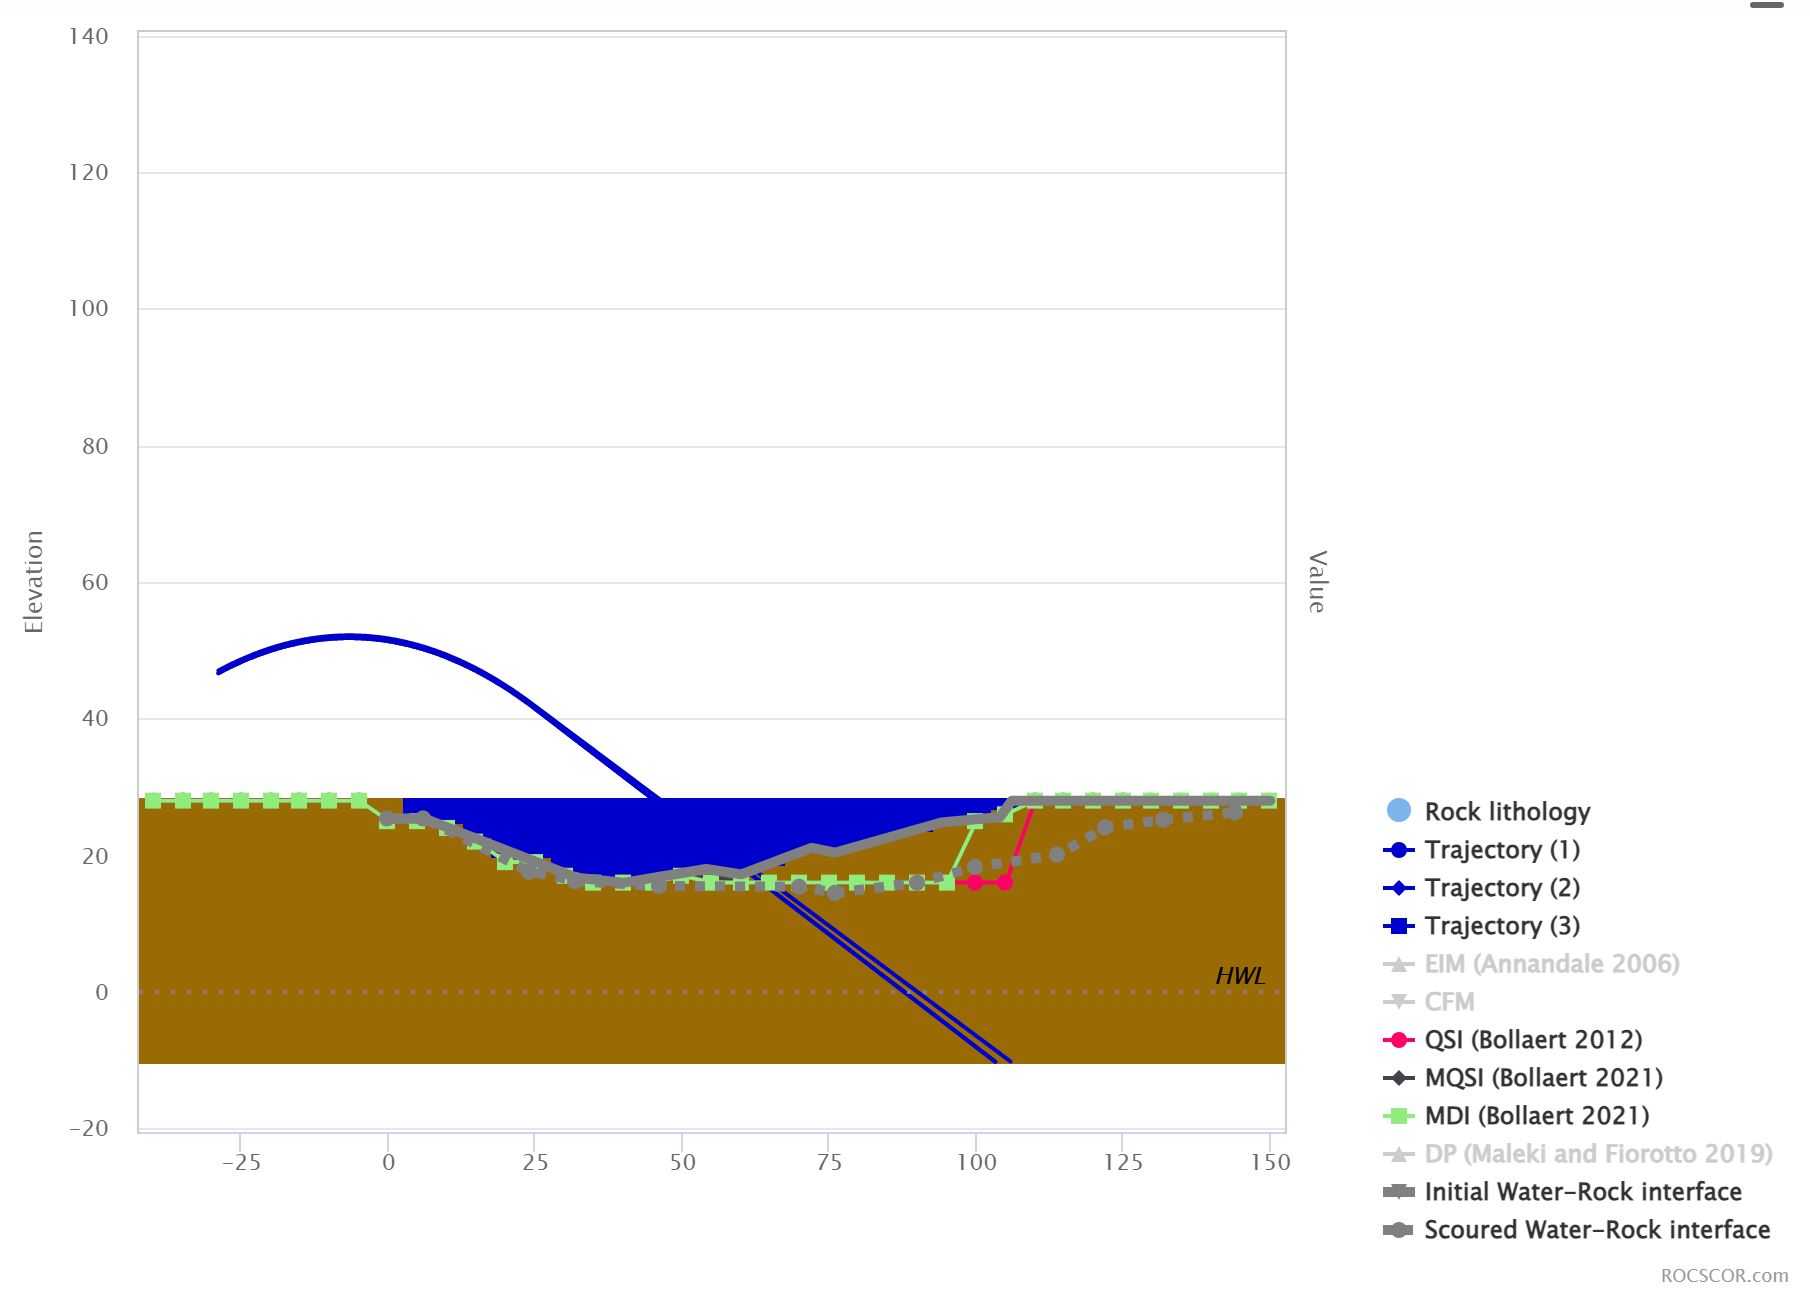
The observed scour hole has been numerically reproduced by applying different rock break-up methods implemented in the rocsc@r software. The results are shown on the figure on the right-hand side for the QSI, MDI and MQSI methods respectively, and by using rock block dimensions of 1m by 4m.
It is believed that the most relevant break-up methods for the Wivenhoe Dam scour case are the QSI and MQSI methods, which express the detachment of blocks by a low-angle impacting jet that generates a high-velocity wall jet along the rocky bottom, and the CFM method, expressing an initial fracturing phase of the rock joints. By matching the observed scour hole to the computed scour hole, the main parameters of these methods could be soundly calibrated.

The rocsc@r scour reproduction (CFM)
The results are shown on the figure on the right-hand side using the Comprehensive Fracture Mechanics (CFM) method, and by using rock block dimensions of 1m by 4m.
The CFM method has been calibrated by assuming that fracturing of joints is the relevant break-up method for the observed scour hole.
The sandstone is considered to be weak and erodible rock, with a UCS strength of ~ 25 MPa. The bedding planes correspond to 2D planar joints (SE) rather than 3D local joints (EL). An initial persistence of fracturing of Pe = 0.40-0.50 has been defined, corresponding to moderately fractured rock.
The figure on the right-hand side presents the computed scour progression with time duration of flood (6-7 h).
The rocsc@r™ scour reproduction (DP and EIM methods)
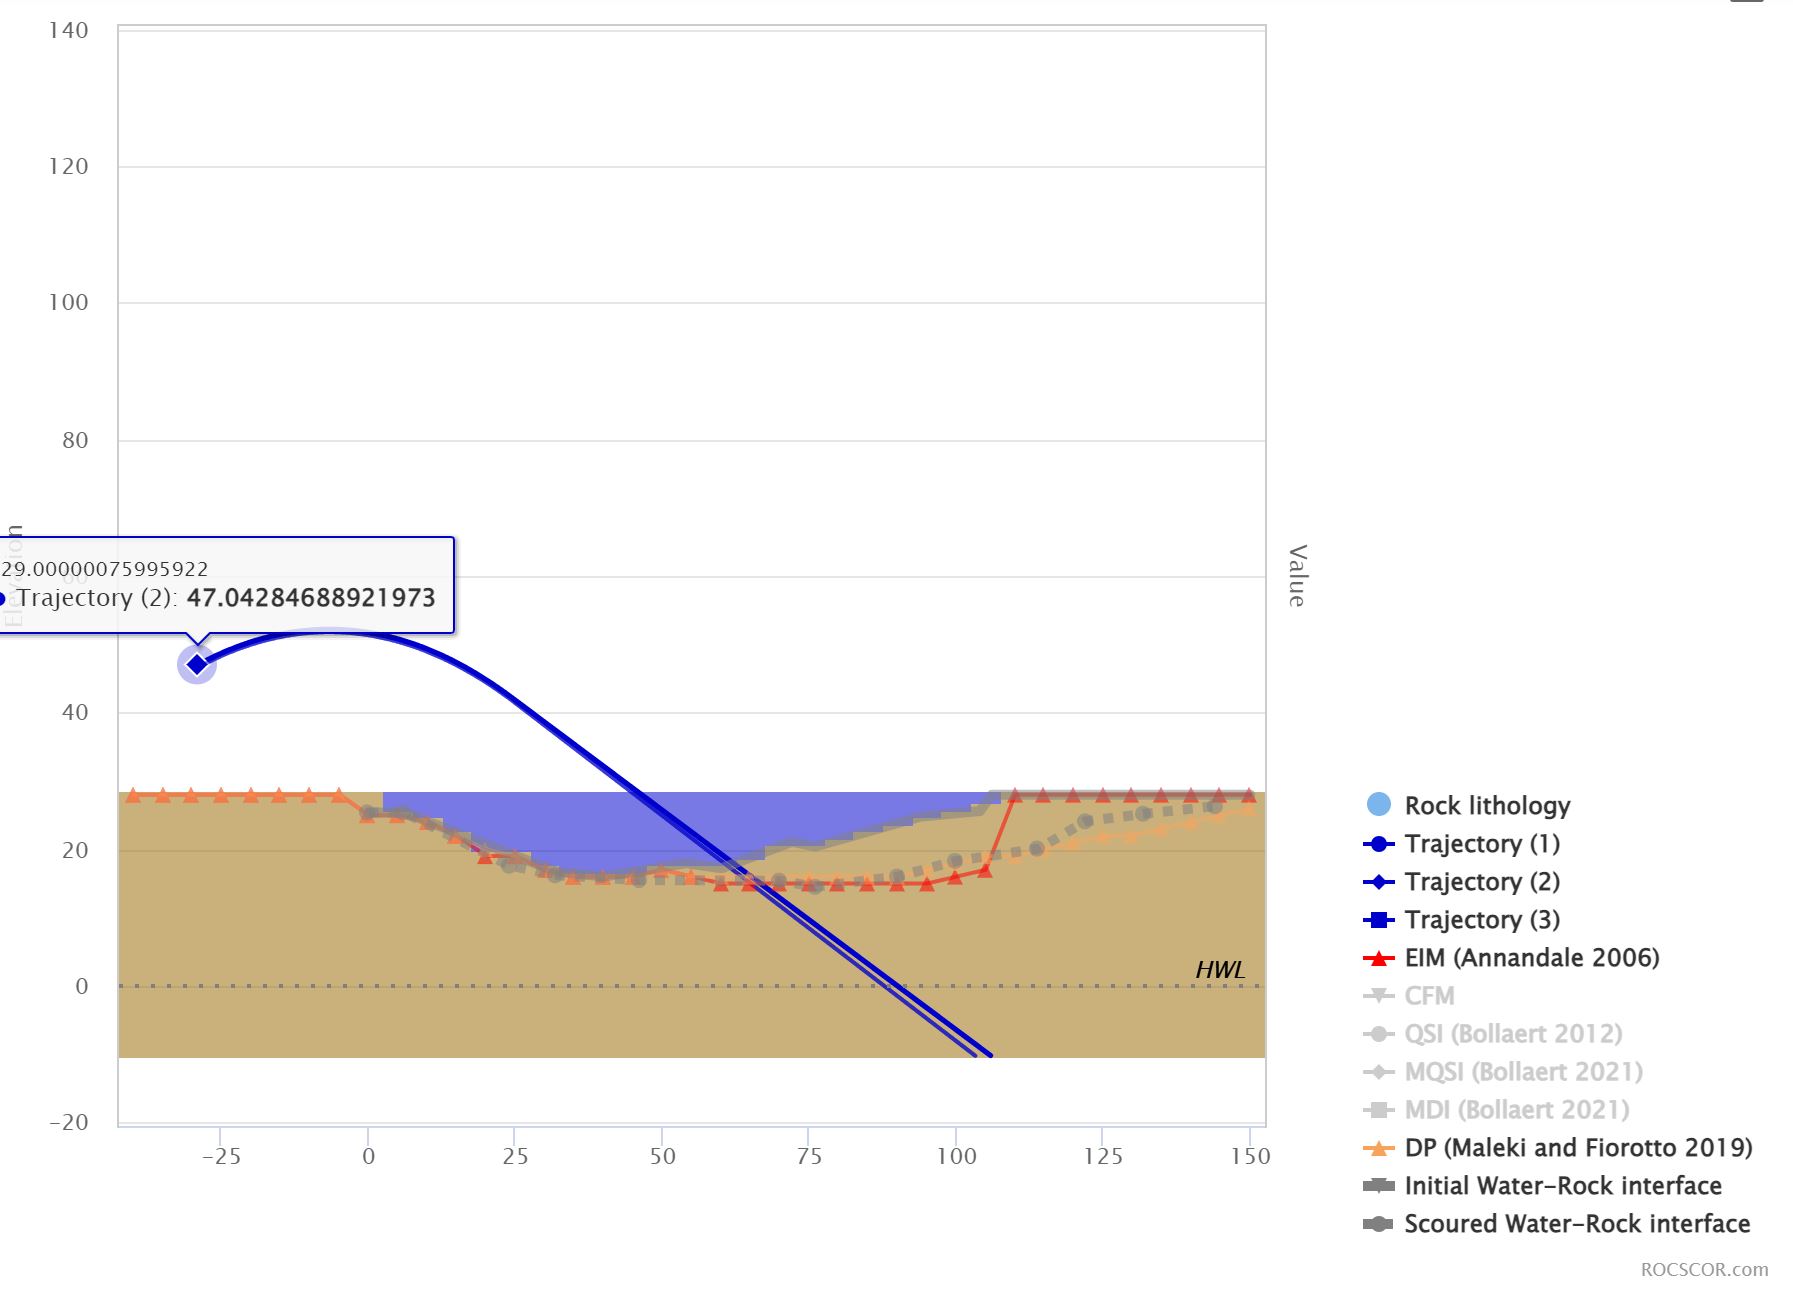
The results are shown on the figure on the right-hand side using the calibration perofrmed for the Dynamic Pressure (DP) and Erodibility Index (EIM) methods, and by using rock block dimensions of 1m by 4m.

